
On this page · 7 sections
TL;DR
- New Relic told me where checkout was slow and how often. It couldn't tell me which line of code was responsible.
- SPX, a free PHP profiler, took about ten minutes to add to Warden. In a couple of days it found a plugin running about a thousand SQL queries per request (a dozen or so after the fix), a marketplace plugin that took about a third of category page time, and a blocking SMTP connect that took close to half of one place-order request.
- The gap between guest and registered checkout came entirely from PHP. The database and the external APIs took the same time for both.
- Turn on caches, use production-sized data, and check which request you actually profiled. Those three mistakes cost me more time than the bugs did.
The store was a large Adobe Commerce 2.4.8 B2B marketplace, and almost everything customers touched was slow: checkout, registration, category pages, admin grids. I had New Relic on it from day one, and it did its job. It told me where the time went in broad buckets. The biggest bucket had no name, and that's the one that mattered.
Why New Relic wasn't enough
I'm not knocking APM here. I used it throughout and still use it. Every limit below is one I hit for real.
The biggest bucket had no name
New Relic splits a transaction into database, external, and everything else. Here's place-order over a week of production traffic:
| Customer type | total | database | external | everything else (PHP) |
|---|---|---|---|---|
| Guest | about 4.5s | about 1s | about 2s | about 1.5s |
| Registered | about 9s | about 1s | about 2s | about 6s |
Database and external time were within a fraction of a second of each other for the two customer types. Almost the whole penalty of roughly 4.5 seconds for a registered customer sat in "everything else". In the slowest orders (over ten seconds), database and external stayed flat while PHP time grew almost tenfold.
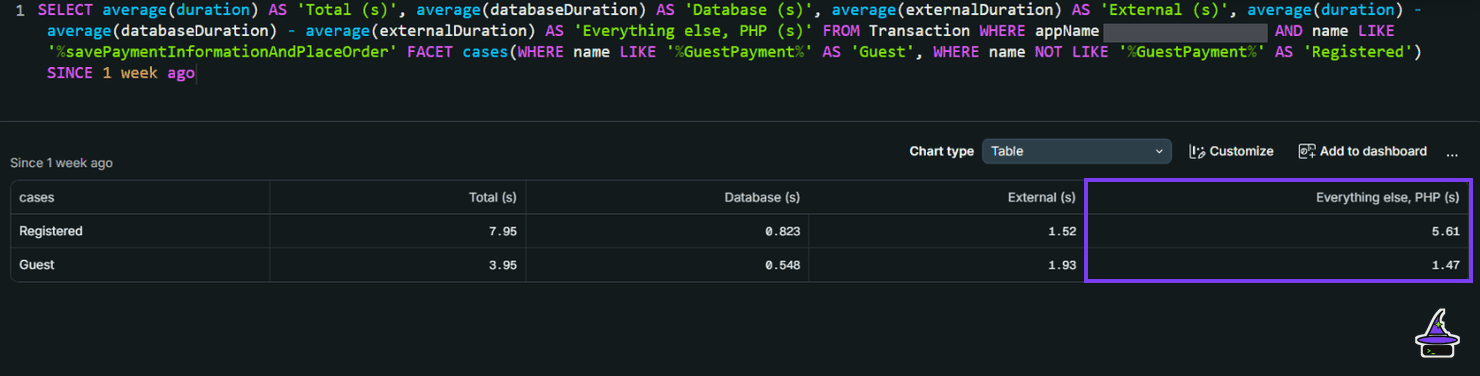
That rules out the database and the payment provider, which is useful. It's also a dead end. On an Adobe Commerce (Magento 2) install with hundreds of plugins and preferences, "PHP" means any of tens of thousands of functions. APM tells you the time exists. It doesn't tell you who spent it.
Query counts without call sites
The B2B registration page ran from several hundred to over a thousand database calls per request, depending on the environment. That count smells, but APM can't say which code issued the queries. A thousand-query N+1 looks the same whether it's one bad loop or 200 well-behaved blocks. SPX pointed at a single plugin method: one call, about two thirds of request time, just over a thousand SQL statements. (The same plugin ran a similar number on the page measured below.) For the raw statements, Adobe Commerce's query log lists every one.
Some calls weren't classified at all
On the search results page, New Relic reported externalDuration = null. SPX showed a handful of sequential OpenSearch HTTP calls through Guzzle, about a third of a second in total. The PHP agent didn't recognise that client as an external service, so the time was folded into PHP, where nobody looked for it.
One transaction name, many code paths
Every Adobe Commerce admin grid loads through mui/index/render. The orders grid, the customers grid and the order-view sub-grids all show up as one transaction. APM gave me a p99 of nearly 20 seconds and a database share of over half, but not which grid. They turned out to have two unrelated root causes, which I'll come back to.
Production mixes slow code with a busy server
The production fleet was running close to its CPU limit. Place-order took a few seconds off-peak and around ten at peak. From APM alone you can't separate slow code from slow code waiting for a CPU. On an idle local box that contention is gone, so whatever is still slow there is the code.
It's easy to read the wrong application
One New Relic account held several apps: production and a couple of staging environments. A query without an appName filter quietly mixed QA traffic into the "production" numbers. I made exactly that mistake. An endpoint I reported as the second-largest query producer on the site, at hundreds of millions of New Relic datastore calls a week, was staging traffic. On production the CDN answered it at the edge and it barely reached PHP. I published a correction.
APM is a statistical view, and the way you slice it can mislead you. A profiler on one request either shows the function or it doesn't.
You can't run before-and-after on production
Proving a fix means the same request, same data and same conditions, before and after. With a profiler on a local copy of production data that takes minutes. With APM it takes a deploy and a week of traffic, and the result still includes everything else that changed that week.
So New Relic tells you where to look and whether a fix worked in the real world. SPX tells you what the code is doing.
Why SPX, and not Xdebug or Blackfire
| Tool | For this job |
|---|---|
| Xdebug profiler | Instruments every call at 2–10× overhead, worse on Adobe Commerce with its interceptor and DI depth. It inflates PHP time but leaves I/O wait unchanged, so external calls look smaller than they are. The store's checkout was dominated by synchronous outbound I/O, so Xdebug would have hidden the problem. SPX's full mode already counts every call in your own code; Xdebug (or SPX with SPX_BUILTINS=1) also counts PHP's built-in functions. |
| Blackfire | Excellent, with a good external-call timeline. It needs a licence and credentials I didn't have. |
| SPX | Free and open source, shipped as a Warden image, with a web UI (flame graph, timeline, flat profile). I measured +16% overhead in sampled mode and about 2.6× with full instrumentation. Its own README still calls it experimental and not production-ready, which is fine for a local stack. |
Setting it up on Warden
Enable SPX in Warden
In the project's .env:
WARDEN_PHP_SPX=1Then:
cp .env .env.bak-prespx       # keep a way back
warden env up -d
Warden pulls the php-fpm:<version>-spx image and starts a separate php-spx container. The normal php-fpm container is untouched, so ordinary page loads stay unprofiled.
How Warden routes requests to the SPX container
Warden's nginx config sends any request carrying the SPX_ENABLED or SPX_KEY cookie or query parameter to php-spx:9000. Everything else goes to the normal pool. You don't change any nginx config yourself. This is the map from Warden's default.conf:
map "...SPX:$cookie_SPX_ENABLED$cookie_SPX_KEY$arg_SPX_ENABLED$arg_SPX_KEY$arg_SPX_UI_URI;" $fastcgi_backend {
    "~DBG:.+;" php-debug:9000;
    "~BF:.+;"  php-blackfire:9000;
    "~SPX:.+;" php-spx:9000;
    default    php-fpm:9000;
}
The order matters: an Xdebug cookie wins over SPX, so clear those first. If a page isn't being profiled, Warden's docs suggest checking the x-backend response header to see which container served it.
- Web UI:
https://<your-site>/?SPX_KEY=warden&SPX_UI_URI=/. Warden's default key iswarden; confirm it withdocker exec <project>-php-spx-1 php -i | grep spx.http_key. - Profile a page: switch profiling on in the UI, which sets the cookies, then browse. The cookies reach the SPX container even with Varnish in front of nginx.
- Profile a REST or AJAX call: add
?SPX_ENABLED=1&SPX_KEY=wardento the URL. - Sampled instead of full: add
&SPX_SAMPLING_PERIOD=1000. The value is in microseconds (the README doesn't say, but the source stores it assampling_period_us), so 1000 is 1ms. On a login page that recorded tens of thousands of samples instead of over ten million calls.
For CLI work (cron jobs, imports, a reindex of one indexer), warden spx opens a shell where every PHP command is profiled. To script it, run the command inside the SPX container instead:
docker exec -w /var/www/html <project>-php-spx-1 \
  env SPX_ENABLED=1 SPX_FP_INC=1 SPX_FP_LIMIT=20 php bin/magento <command>
The flat profile is SPX's default CLI report (SPX_REPORT=fp). It prints a ranked table of functions (inclusive and exclusive wall time, memory, call count) to STDERR when the command ends. SPX_FP_INC=1 sorts by inclusive time instead of exclusive, and SPX_FP_LIMIT caps the rows (the default is 10).
Each web profile lands in /tmp/spx inside the SPX container, as a .txt.gz trace plus a .json metadata file:
{
  "http_request_uri": "/customer/account/login/",
  "http_method": "GET",
  "wall_time_ms": 25000000,
  "called_function_count": 12000,
  "call_count": 13000000
}
Two gotchas in that file. First, wall_time_ms holds microseconds, despite the name: the 25000000 above is about 25 seconds. Second, the first request after the stack starts is very slow while caches and opcache warm up. My first profiled login page, a cold run, took the better part of a minute end to end; the 25-second example above came later. Throw the cold run away.
Check these before you trust an SPX profile
I wish someone had handed me this list on day one.
Extension parity. Compare the loaded modules in both containers. If one has opcache, redis or newrelic and the other doesn't, profiles take a different code path. In mine, the only difference was SPX itself:
diff <(docker exec <project>-php-fpm-1 php -m) <(docker exec <project>-php-spx-1 php -m)
# > SPX
Adobe Commerce caches on. My local developer-mode setup had every cache disabled. A homepage render went from about 18 seconds to about 5 after bin/magento cache:enable. A profile taken with caches off measures cache-miss paths that production never runs. Bin it.
Warm-up discarded. Drop the first request after any cache flush.
Realistic data. I profiled against a PII-sanitised copy of production. N+1 bugs only show up when tables are production-sized: about a thousand brand options, and tens of thousands each of marketplace products and customers.
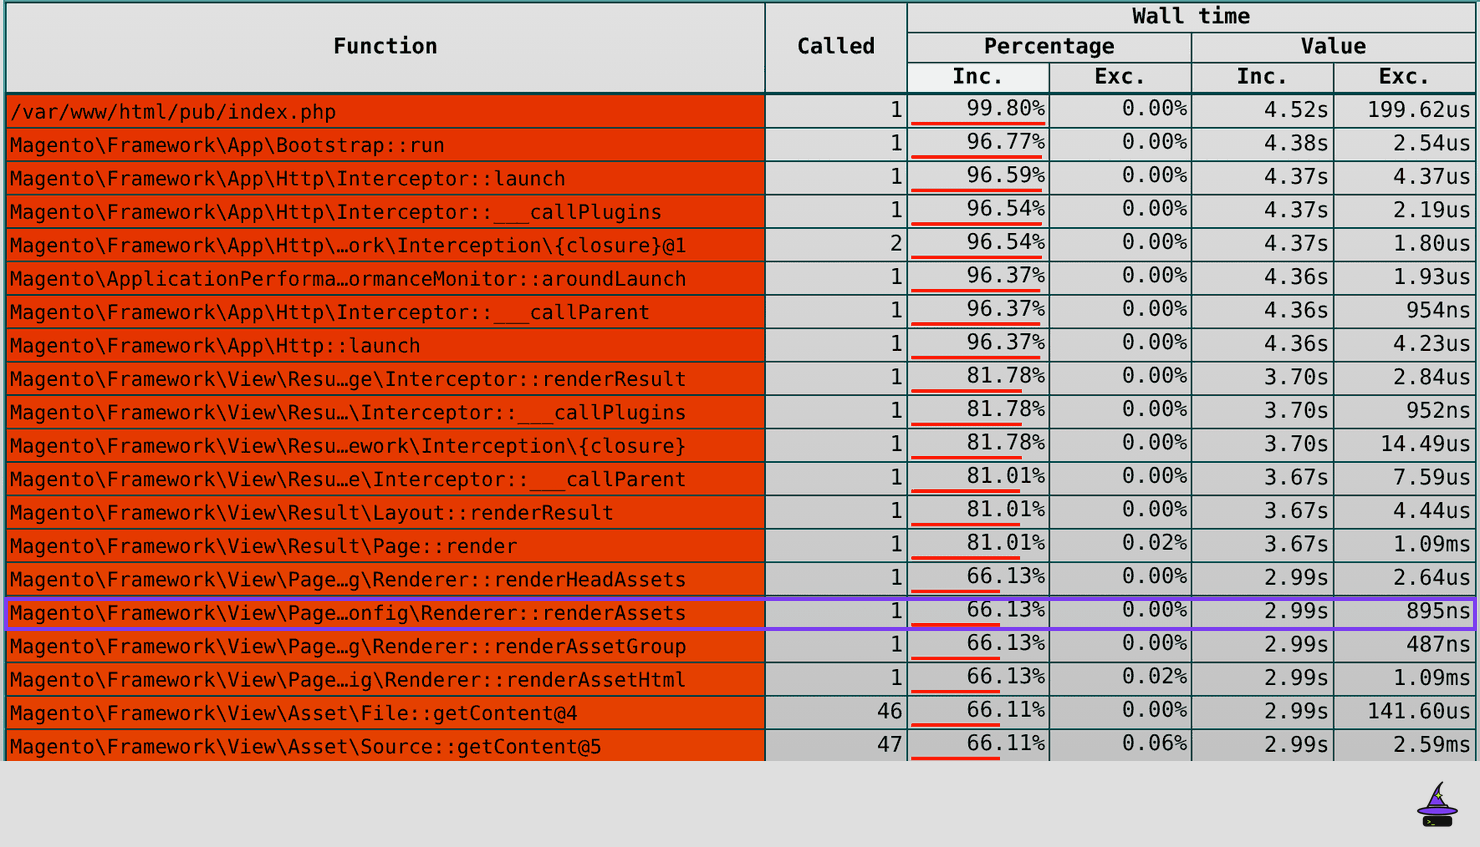
Developer-mode noise. With uncompiled DI you'll see hundreds of thousands of ObjectManager::get, AbstractFactory::resolveArgument and Less_Parser calls. Ignore them, or run setup:di:compile and switch to production mode for the final measurement. A real bottleneck, one plugin call with seconds of inclusive time, stands out either way.
How I used it day to day
Sampled first, full instrumentation second
Sampled mode, at about 16% overhead, gives a realistic picture of where wall time goes. Full instrumentation, at about 2.6×, gives exact call counts and inclusive and exclusive time per function. That's the mode for finding N+1s and for before-and-after comparisons.
Read the flat profile, not just the flame graph
The flame graph is good for exploring. The answer was almost always in the flat profile sorted by inclusive time. I looked for three shapes:
- One call with huge inclusive time: a plugin or observer doing something expensive once. That's how I found a marketplace extension's
afterAddAttributeToSortplugin taking a second and a half on a page that has nothing to do with that extension. - A huge call count on a cheap function:
PDO::executeabout a thousand times, or a collection'sgetIdFieldNameover a hundred thousand times, means a loop over something that grows with your data. - Big exclusive time in an I/O function:
SocketStream::initialize(SMTP) at nearly four seconds andCurlHandler::__invokeat under two mean synchronous network calls inside the request.
Then read the source. In each case the profiler gave me a function name, and a few minutes in the code gave me the root cause.
Flat profiles for HTTP requests, and the newest-file trap
The flat profile report only exists for CLI runs. Web requests always produce a full report, saved to disk and normally viewed in the UI. To script before-and-after comparisons I wrote two small helpers: a runner that fires the request with the SPX parameters and picks out the matching trace, and a parser that turns a trace into a table of inclusive ms, exclusive ms and call count.
The trap: every storefront page fired a trailing AJAX call, a CDN geo-lookup endpoint, right after it loaded. "Pick the newest trace file" silently picked the AJAX call instead of the page. I misattributed a few profiles before I noticed. Each report's metadata file has http_request_uri. Match on that, never on file time.
Make each profile repeatable
For every finding I wrote down the exact URL, data state, cache state and profiler mode, so the "after" run was a true like-for-like comparison.
What I found
A brand plugin: about a thousand queries down to a dozen or so
A custom plugin built a brand-to-URL map by calling fetchRow() once per brand option, inside a loop, on a page-render path. It only memoised on the object instance, so every request paid the full cost again. The fix was a single JOIN that returns the whole map, keeping the original "first row wins" behaviour. I added no caching, so there's no new staleness risk.
| Measure | before | after |
|---|---|---|
| SQL statements | about a thousand | a dozen or so |
| PDO execute time | about 500ms | about 20ms |
| Plugin inclusive time | about 800ms | about 100ms |
| Request wall time (instrumented) | about 1.2s | about 0.6s |
| Total function calls | nearly 500,000 | about 340,000 |
The honest footnote: New Relic, filtered properly this time, later showed this path was hot on staging but not on production's high-volume routes. The fix removed a latent hazard rather than recovering production capacity. I only know that because I went back and checked.
Category pages: a vendor plugin looping over the whole catalogue
A marketplace extension's afterAddAttributeToSort plugin runs on every product listing, because every listing applies a default sort. It loaded the entire marketplace-product mapping table, tens of thousands of rows, with no filter, and looped over it in PHP to build an exclusion list. That one call took a second and a half of about five, roughly a third of the page.
New Relic showed category pages at under a tenth database time, so nobody had looked at the data layer. The cost wasn't in SQL. It was in hydrating tens of thousands of models in PHP, and only a function-level profiler could see that.
Checkout: a blocking SMTP connect inside place-order
Profiling the place-order REST call:
| Function | exclusive | calls |
|---|---|---|
SMTP SocketStream::initialize | nearly 4s | 1 |
Guzzle CurlHandler::__invoke | under 2s | 2 |
| All SQL combined | about 200ms | a few hundred |
Close to half the request went on opening a mail socket. Locally the SMTP host was unreachable, which made the number bigger than it would be in production. The shape still matched production's large uninstrumented PHP bucket: synchronous email and HTTP calls on the customer's critical path. Registration showed the same pattern, with a few synchronous transactional emails per submission. My recommendation was to move transactional email to the message queue.
Admin grids: SPX plus EXPLAIN
For the grids, I drove the UI component data providers directly, with Adobe Commerce's DB profiler attached and the real page size (LIMIT 20).
- Orders grid: a custom column plugin joined a derived subquery over
sales_order_status_history, filtered onstatus, which had no index. Every grid load, page turn and filter change did a full scan, a temp table and a filesort. The fix was one index. - Customers grid: the joins were indexed properly, but a
COUNT(*)over a multi-table join of every customer ran on every interaction. That needs a design change, not an index.
What I'd tell another Adobe Commerce team
- Use APM for triage and a profiler for the root cause. If the "everything else" bucket is big, stop querying APM and start profiling.
- Turn caches on before you profile. I can't stress this one enough.
- Profile against production-sized data. N+1s hide on small dev databases.
- Use sampled mode for the overall picture and full instrumentation for counts. Reach for Xdebug, or
SPX_BUILTINS=1, only when you need PHP's built-in functions counted too and don't care about timing. - Check which request you profiled. Trailing AJAX calls will catch you out.
- Local timing isn't production timing. Call counts and the shape of a profile carry over; absolute milliseconds don't, especially against a loaded fleet.
- Filter APM by application. A shared account can quietly mix staging into production.
- Close the loop. After the deploy, go back to New Relic and check the real numbers. Sometimes, as with the brand plugin, the answer is a smaller win than you hoped.
- Write down what you got wrong. I corrected a few of my own earlier figures during this work, and people trusted the remaining numbers more because of it.
Cheat sheet
# enable (set WARDEN_PHP_SPX=1 in .env, then)
warden env up -d

# make profiles meaningful
warden shell -c 'bin/magento cache:enable'

# web UI
open "https://<site>/?SPX_KEY=warden&SPX_UI_URI=/"

# profile one request, full instrumentation
curl -sk "https://<site>/rest/V1/...?SPX_ENABLED=1&SPX_KEY=warden"

# same, sampled every 1ms (value is in microseconds)
curl -sk "https://<site>/some/page?SPX_ENABLED=1&SPX_KEY=warden&SPX_SAMPLING_PERIOD=1000"

# or with cookies (works through Varnish)
curl -sk -b "SPX_ENABLED=1; SPX_KEY=warden" "https://<site>/some/page"

# find the trace for a specific URL (don't trust "newest file")
docker exec <project>-php-spx-1 sh -c \
  "grep -l '\"http_request_uri\": \"\\\\/some\\\\/page' /tmp/spx/*.json"

# profile a CLI command with a flat report
docker exec -w /var/www/html <project>-php-spx-1 \
  env SPX_ENABLED=1 SPX_FP_INC=1 SPX_FP_LIMIT=20 php bin/magento <command>

# or just open a profiled shell
warden spx

# disable when done (the extra container costs memory;
# clear the SPX cookies or the next page load is a 502)
sed -i 's/WARDEN_PHP_SPX=1/WARDEN_PHP_SPX=0/' .env && warden env up -d
The source and docs are in the php-spx repository on GitHub.